
The Cell Surveys App: Multi-Sensor Signal Surveys From Your Phone
Turn any iPhone or Android into a professional RF survey tool. Capture cellular (RSRP, RSRQ, SINR), WiFi, Bluetooth, and magnetic-field readings—GPS-tagged, mapped live, and ready to export.
Running a DAS RFP or need a full building survey? Explore our professional survey service
One App. Every Signal.
The Cell Surveys app puts professional-grade signal measurement in your pocket—free on the App Store and Google Play.
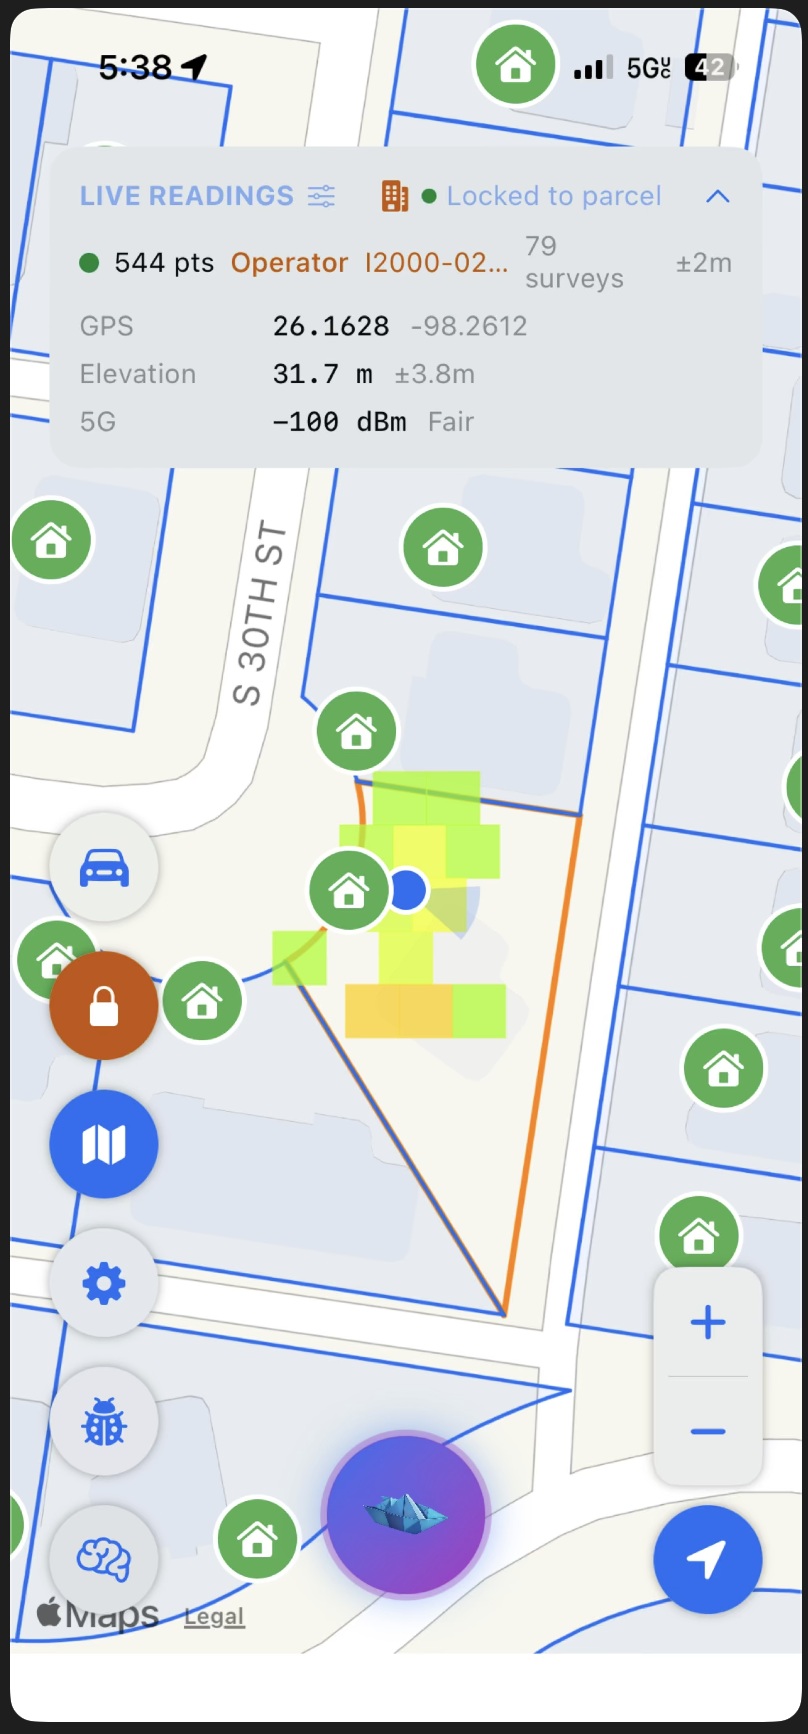
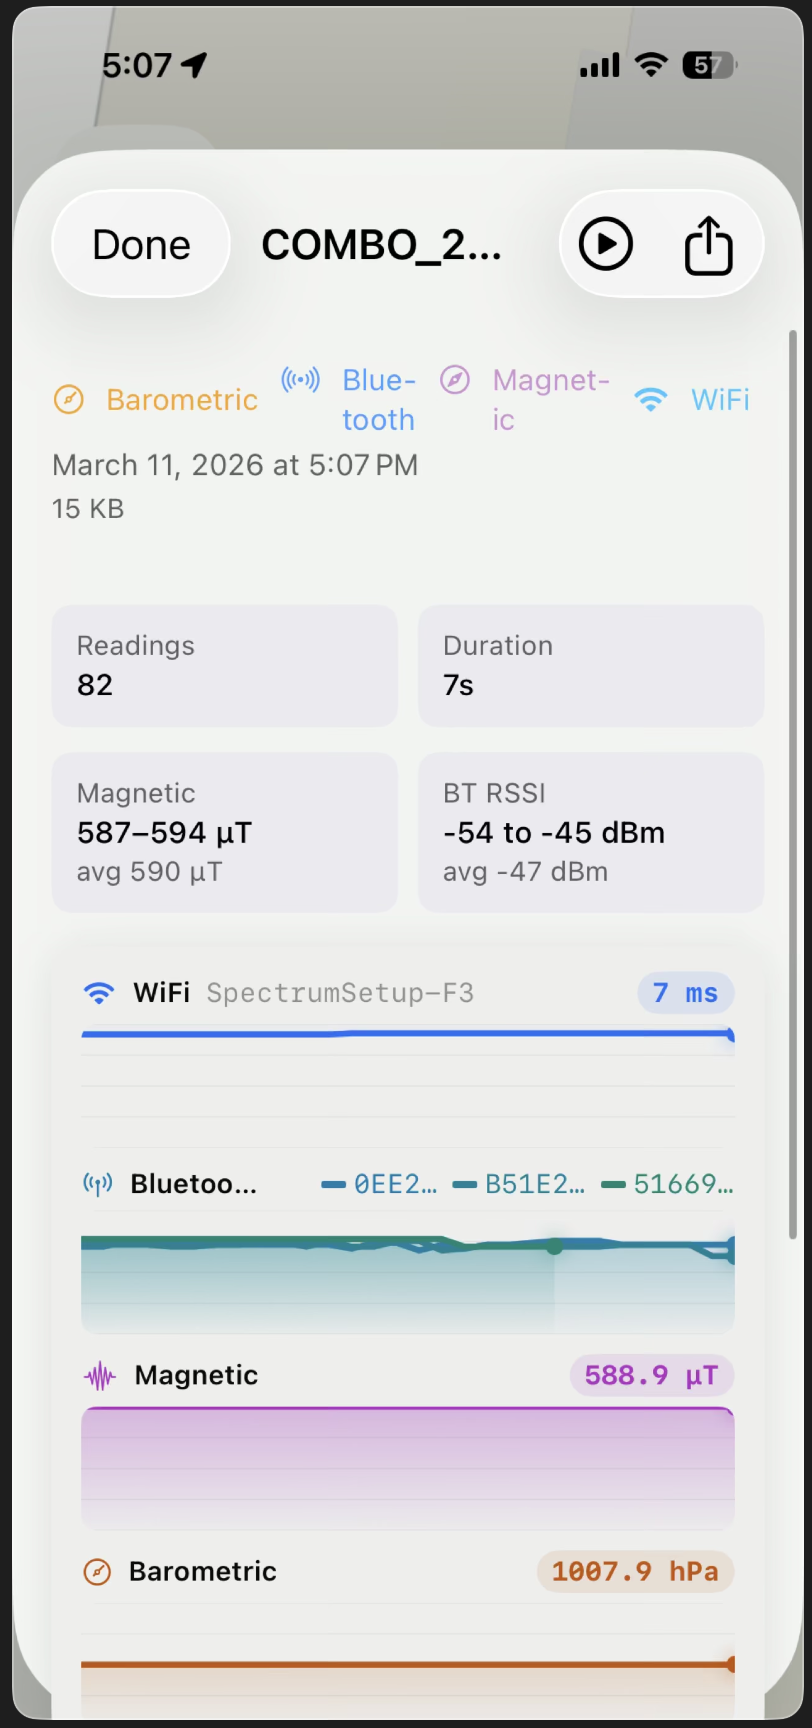
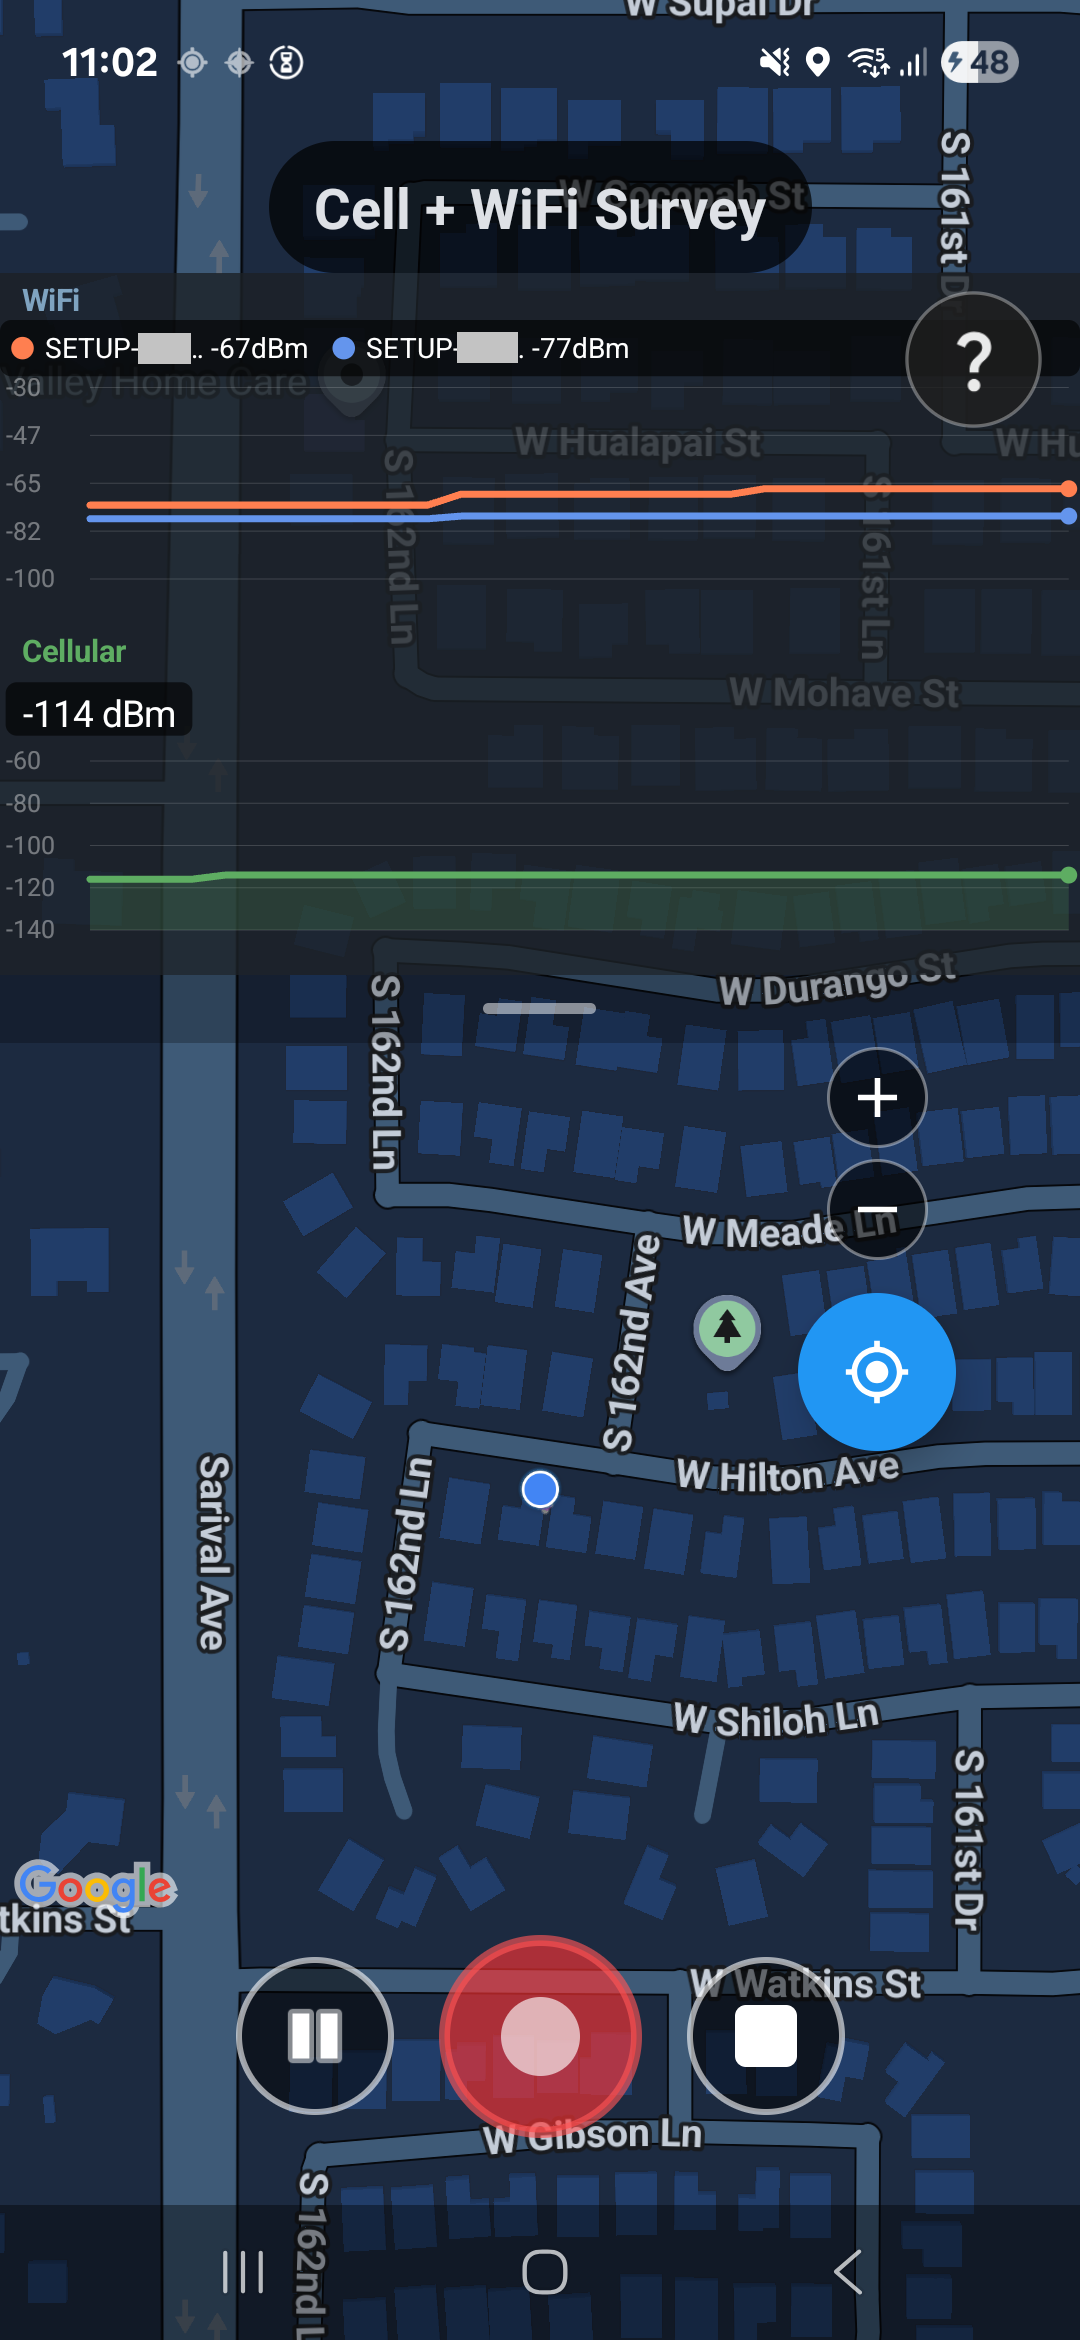
Multi-sensor capture
Cellular (5G/LTE), WiFi, Bluetooth, magnetic field, and elevation recorded at every GPS-tagged data point.
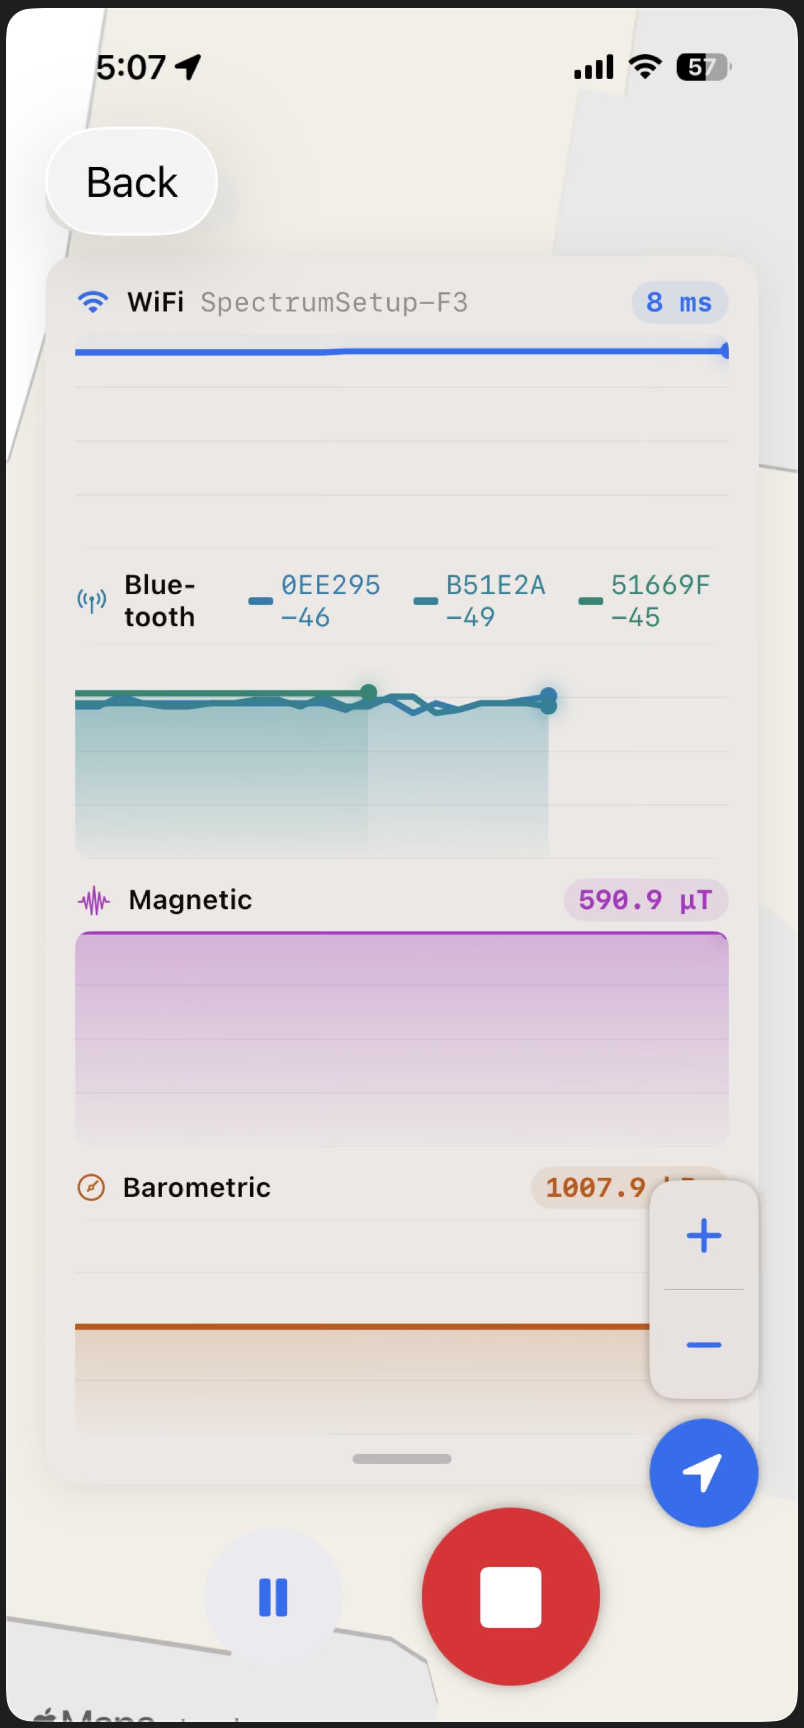
Live readings panel
Watch RSRP, RSRQ, SINR, and every other sensor update in real time as you walk a space.
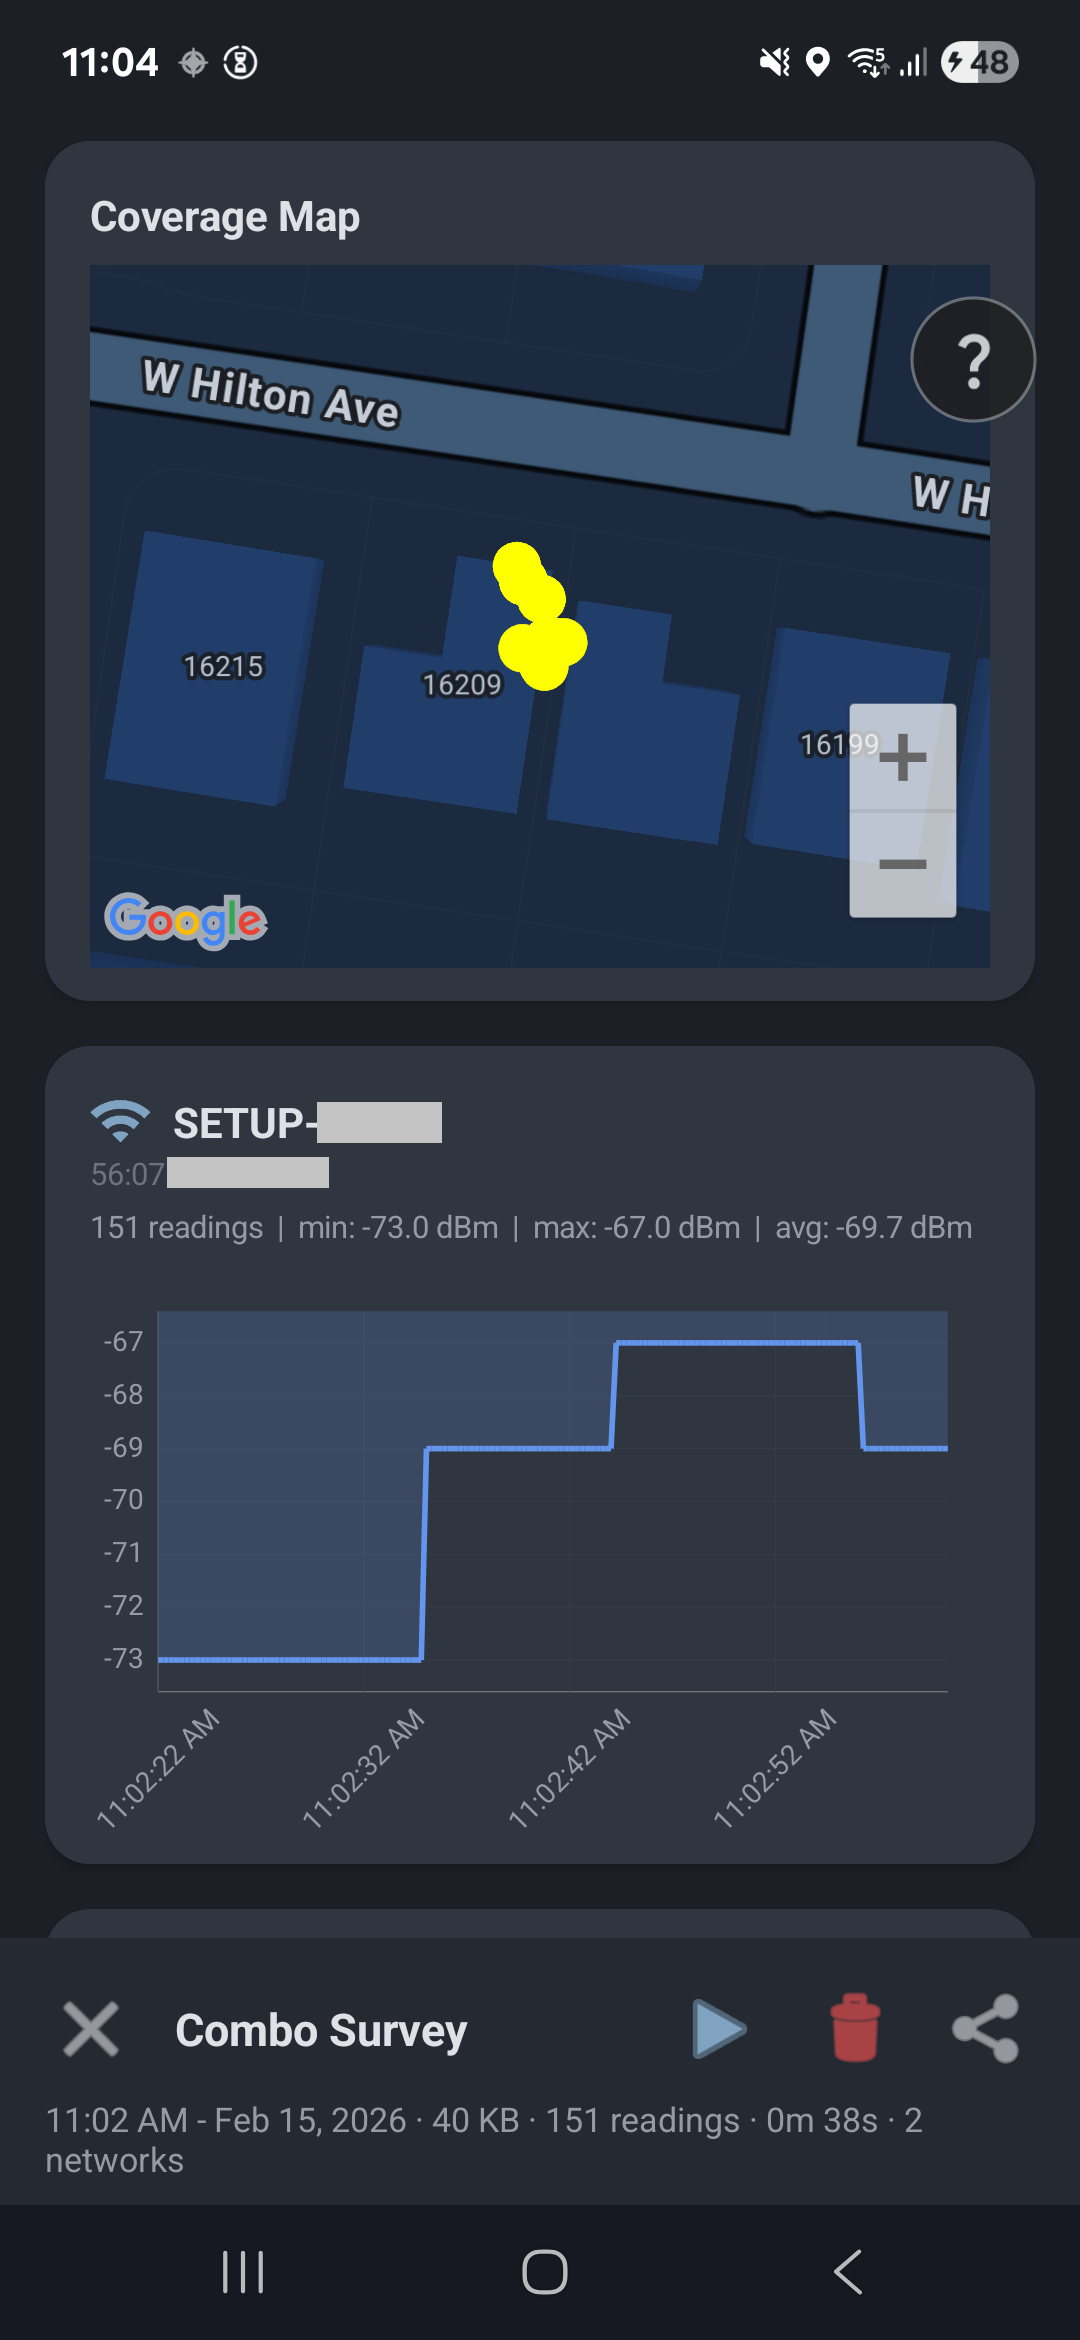
Maps, playback & archives
Instant coverage maps, timeline playback of any survey, and a searchable archive of every session.
Private by design
Data stays on your device with optional Google Drive backup. No tracking, no ads, no data sales.
Trusted by DAS integrators, facility managers, and telecom consultants nationwide
Beyond the App: Professional Survey Services
When a project needs certified, RFP-grade data, our team runs the onsite survey and builds the dashboards for you.
- Multi-carrier RF measurements across all major operators at every test point
- Indoor/outdoor grid-based testing with precise GPS and floor-level accuracy
- Professional heatmaps, statistical reports, and RFP-ready documentation
- Interactive coverage heatmaps with floor-by-floor drill-down and zone filtering
- Multi-carrier comparison charts for side-by-side operator performance analysis
- DAS compliance scoring with pass/fail thresholds aligned to industry standards
Industries We Serve
Every facility type has its own RF signature. Browse the verticals where we have deep measurement experience.
Hospitals & Healthcare
Lead-lined imaging rooms, dense concrete, deep floor plates, and ERRCS compliance pressure. We document the RF environment hospitals actually have.
Learn moreWarehouses & Distribution
Metal envelopes, high-bay racking, refrigerated zones, and dock-door coverage cliffs. We measure where scanners, AMRs, and IoT actually run.
Learn moreWhy Real-World Signal Data Beats Theoretical Models
Traditional drive tests miss what matters most. Our onsite approach captures the full picture.
Traditional Drive Tests
- Measure from vehicles on roads
- Miss indoor coverage entirely
- Can't capture floor-by-floor variation
- Limited to carrier-provided data
Cell Surveys Onsite Approach
- Measure inside buildings where people actually work
- Capture every floor and zone
- Multi-carrier measurements at every test point
- Real-world data from real devices
Ground Truth Data
Real measurements from real devices in real locations — not theoretical propagation models or carrier estimates.
Multi-Carrier Coverage
Every carrier measured at every point, simultaneously. Compare AT&T, Verizon, T-Mobile, and more side by side.
Actionable Intelligence
Data formatted for DAS RFPs, compliance scoring, and decision-making — not raw signal dumps that require interpretation.
See Your Signal Data Come to Life
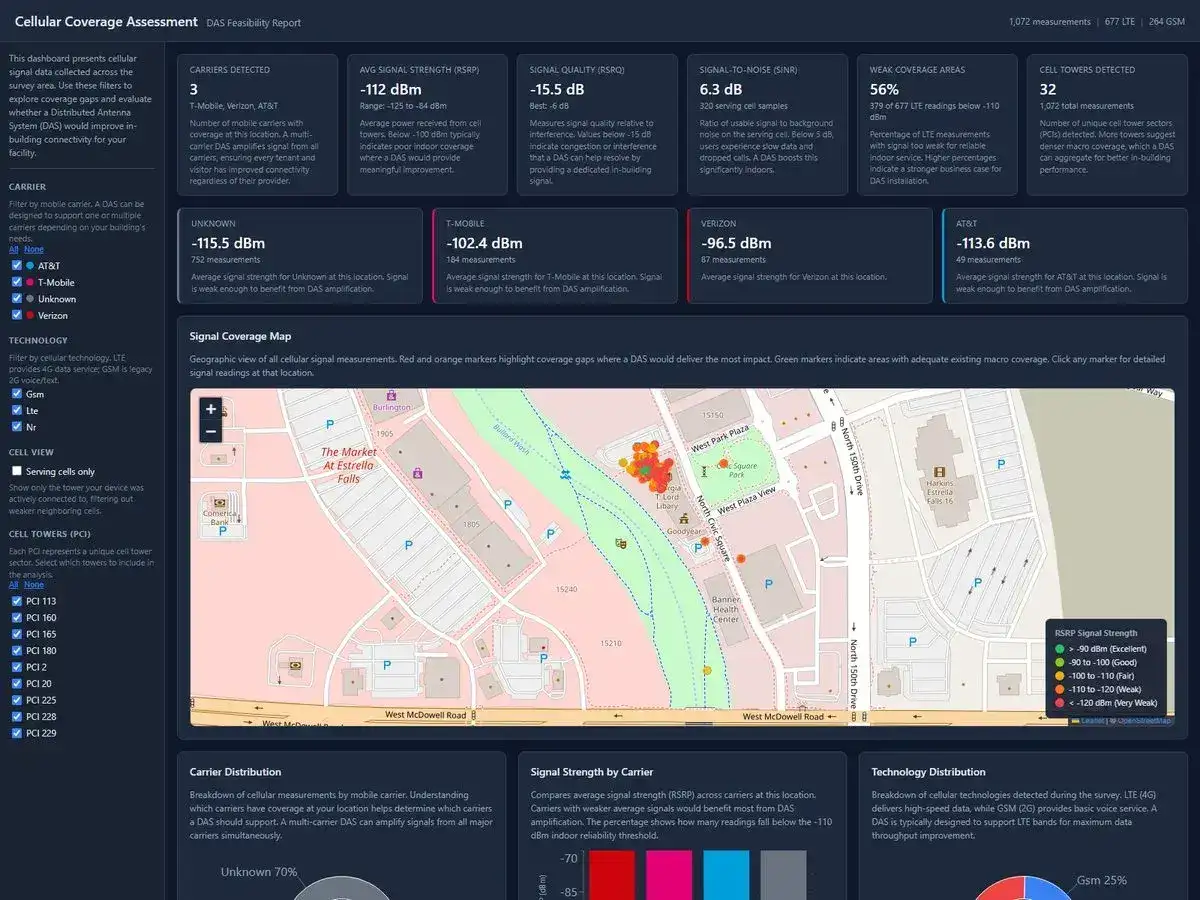
Every survey includes a custom, interactive dashboard built for your specific facility and needs.
2,624 readings • 48 scans • February 17, 2026
Carriers Detected
4
AT&T, Verizon, T-Mobile, Dish
Avg Signal (RSRP)
-89 dBm
Range: -117 to -62 dBm
Signal Quality (RSRQ)
-11.2 dB
Best: -4 dB
Signal-to-Noise (SINR)
8.4 dB
1,247 serving cell samples
Weak Coverage Areas
34%
892 of 2,624 below -110 dBm
Cell Towers Detected
18
2,624 total measurements
AT&T
-84 dBm
812 measurements
Verizon
-91 dBm
756 measurements
T-Mobile
-87 dBm
689 measurements
Dish
-102 dBm
367 measurements
Average RSRP across all test points. Red dashed line = -110 dBm indoor threshold.
Our custom dashboards transform raw RF measurements into interactive heatmaps, multi-carrier comparison charts, and DAS compliance scores that make decision-making straightforward.
Explore dashboard capabilitiesHow It Works
From initial survey to final deliverable, our streamlined process gets you the data you need.
Survey
We collect precise RF measurements at your facility using professional-grade equipment and our proprietary survey methodology. Every carrier, every floor, every zone.
Analyze
We process raw signal data into actionable insights, identifying coverage gaps, comparing carrier performance, and scoring DAS compliance against industry thresholds.
Deliver
You receive a custom interactive dashboard and professional reports ready for DAS RFPs, stakeholder presentations, and ongoing coverage monitoring.
Frequently Asked Questions
What is a DAS signal survey?
Why do I need an onsite signal survey for a DAS RFP?
What measurements do you collect during a signal survey?
How long does a typical signal survey take?
What is included in a Cell Surveys custom dashboard?
Do you support multi-carrier and 5G measurements?
Ready to Get Real-World Signal Data?
Download the Cell Surveys app to start surveying today, or contact us for a professional onsite survey or custom dashboard.